Using local newspaper, find and discuss examples of uses of statistics and the ways in which the information is presented
Students will be able to create charts using statistical data
Students will be able to collect statistical data from news sources
Show Me Standard:
Social Studies #7
The use of tools of social science inquiry (such as surveys, statistics, maps, documents)
Goal#2 Students will acquire knowledge and skills to communicate effectively within and beyond the classroom
2.1 Plan and make written, oral, and visual presentations for a variety of purposes and audiences
2.7 Use technological tools to exchange information andideas
Kansas Standards
Benchmark 4: The student engages in historical thinking skills.
2. (A) examines a variety of primary sources in history and analyzes them in terms of credibility, purpose, and point of view (e.g., census records, diaries, photographs, letters, government documents).
The Independence Examiner
ClarisWorks Word Processing/ Spreadsheet/ Chart making program
Procedure: Lesson One: Instruction
1. Pass out questionnaires to students asking how they got to school. Students are asked to circle the word that describes how they got to school: car, van,truck, motorcycle, bicycle, school bus, walk
2. Gather papers together and as a class go through the process of compiling the information.
3. Discuss options for ways information can be gathered, and pros and cons for each:
- Interviews
- Questionnaires
- Researching documents
4. Discuss options for recording the information gained through the various methods of surveying:
- tallying
- listing responses
- grouping
5. Discuss options for presenting the information:
- line graphs
- pie graphs
- pictographs
- paragraphs
Procedure: Lesson Two: Assignment: Each student will be required to choose a topic on which they would like to do a survey. The surveys will involve our class, a particular grade level at Procter, or all the Procter classrooms.
Each student will turn in the following form stating their first and second choices for survey topics.
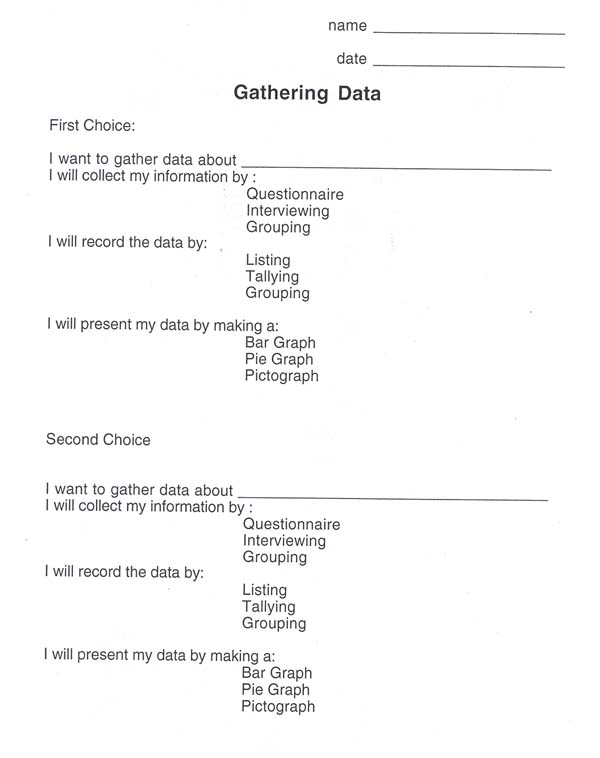
After being approved by the teacher, each student will conduct their survey, and record the information.
The students will be required to create a line graph showing their results using graph paper and colored pencils.
The students will also be required to write a paragraph explaining what the subject of their survey was, as well as the results.
Procedure: Lesson Three: Use of Technology
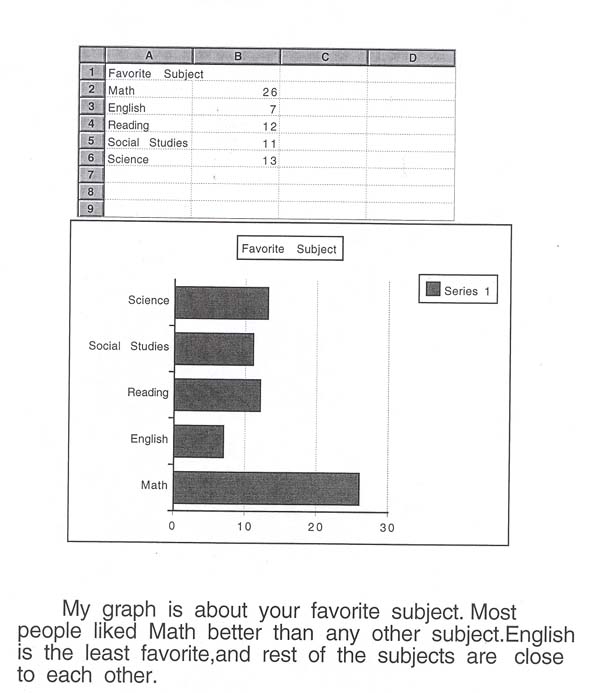
The students will be instructed on the use of ClarisWorks to create graphs, and will use the results of their individual surveys to enter information on a spreadsheet. Using the ClarisWorks program, the information will be converted to a graph format. Students will choose the type of format they think is appropriate for their survey.
Students will also be required to type their paragraphs on theClarisWorks document along with their graphs.
The documents will be printed out and displayed.
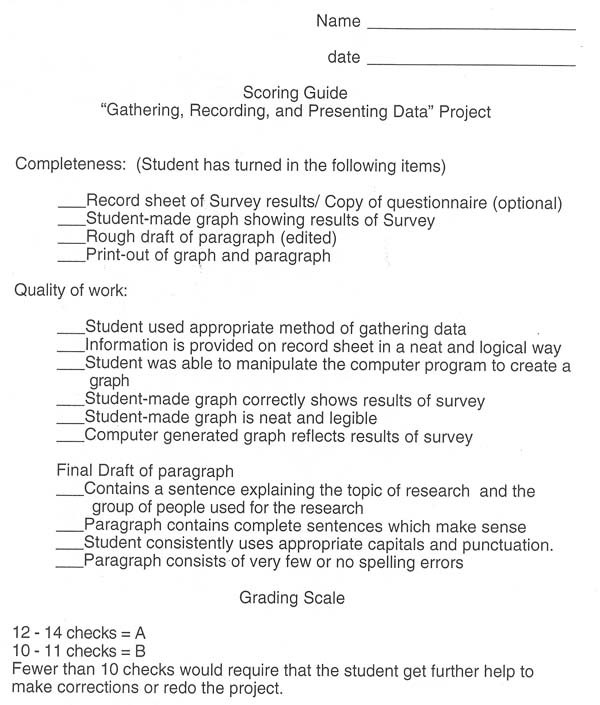
The projects will be assessed according to the following scoring guide